

 Home
Home About Us
 Ag Library
 Ag Tech
 Ag Funding
 Ag Events
 Ag Directory
 Ag News
 Ag Innovation
 Contact Us
$10 Million On Farm Connectivity Program Round 3 Opens
$10 Million On Farm Connectivity Program Round 3 Opens Ag Web Design Opportunity
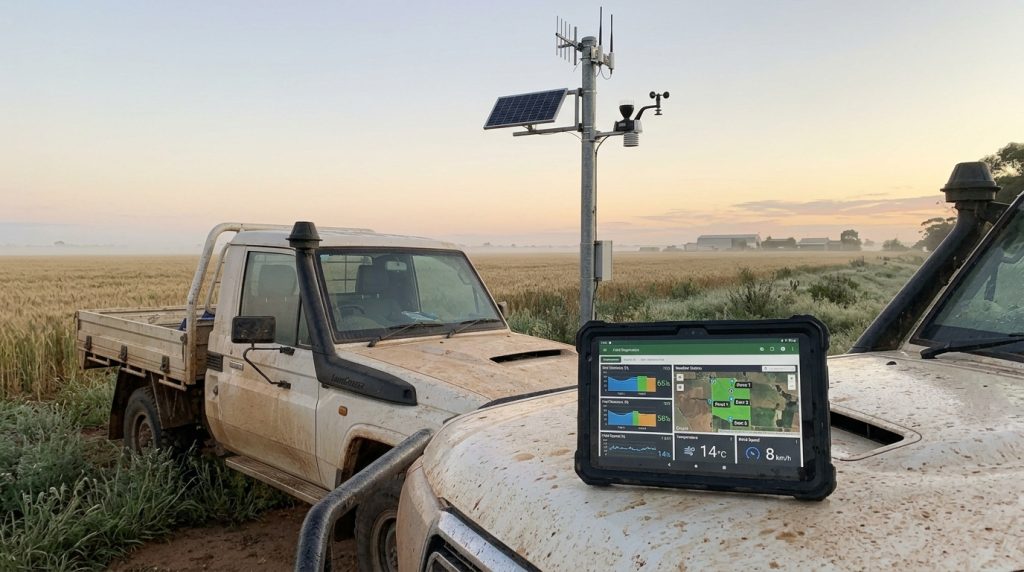
The $10 million Round 3 rebate pool expands Australia’s On Farm Connectivity Program to $43 million across three rounds, supporting eligible primary producers with connected machinery, sensors, and digital farm technology.
Farmers are adopting more technology, but cost, connectivity, and unclear returns still affect purchasing decisions. This guide examines what Round 3 means for producers and the agribusinesses marketing these solutions.
Key Statistics on $10 Million On Farm Connectivity Program Round 3
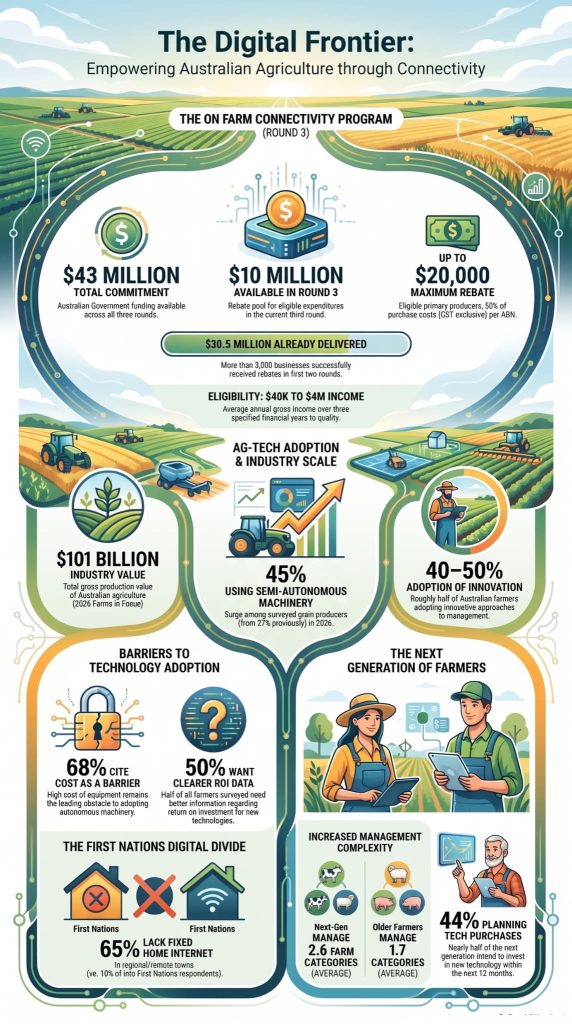
These figures show the scale of government support, technology adoption, affordability barriers, and the changing structure of Australian farm businesses.
- $43 million – Total On Farm Connectivity Program funding across three rounds. The Australian Government says the program has up to $43 million available across the three rounds.
- $10 million – Round 3’s available rebate pool for eligible expenditure.
- $20,000 GST exclusive – Maximum Round 3 rebate per eligible primary producer ABN, with rebates covering up to 50% of eligible purchase costs.
- $30.5 million to almost 3,000 producers – The first two rounds delivered more than $30.5 million in rebates to almost 3,000 primary production businesses.
- $40,000–$4 million – Eligible primary producers must have average annual gross income within this range over the specified three financial years.
- 45% using semi-autonomous machinery – The supplied 2026 GPA data indicates adoption among surveyed grain producers increased from 27% the previous year.
- 68% cite cost as a barrier – The supplied GPA survey data shows cost remains a leading obstacle to autonomous machinery adoption.
- 40–50% – Share of Australian farmers adopting innovative approaches to farm management, according to the 2026 Farms in Focus research.
- 50% – Farmers wanting clearer information about technology ROI, according to the supplied Farms in Focus data.
- 2.6 vs 1.7 farm categories – Next-generation farmers manage an average of 2.6 farm categories compared with 1.7 among older farmers.
- 44% – Next-generation farmers planning technology purchases within the next 12 months.
- 65% vs 10% – First Nations respondents surveyed regional and remote towns without fixed home internet compared with non-First Nations respondents.
- $101 billion – Australian agriculture’s gross production value cited in the 2026 Farms in Focus research.
How Does $43 Million In Total On Farm Connectivity Program Funding Change The Opportunity?
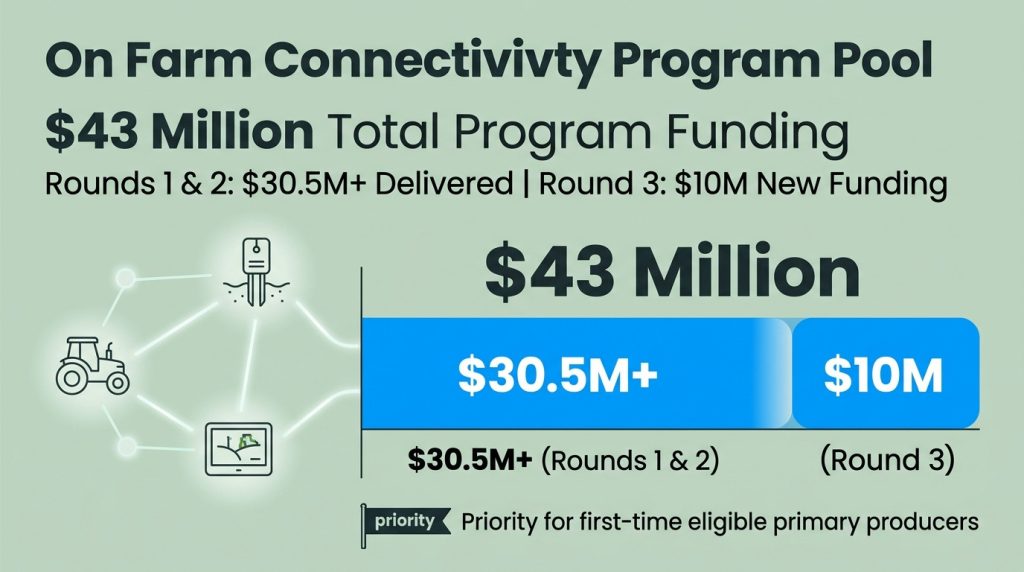
The $43 million three-round program gives eligible primary producers a substantial public funding pathway for connectivity and connected agricultural technology.
The Australian Government says the program supports agriculture, forestry, and fisheries businesses using connected machinery and sensor technology. Round 3 is part of the wider Better Connectivity Plan for Regional and Rural Australia.
The funding supports areas such as:
- Connectivity equipment
- Environmental monitoring
- Farm management systems
- Remote automation
- Low-power network equipment
Connectivity now plays a bigger role in how farms collect data, monitor assets, automate tasks, and manage daily work. The program links physical infrastructure with digital agriculture.
For agribusinesses, it’s useful to understand what products qualify, how much they cost, and what farm problem they can solve.
- $43 million: Total funding across three rounds
- Rounds 1 and 2: More than $30.5 million in rebates
- Round 3: $10 million in additional funding
- Priority: Eligible producers without earlier support
This also creates demand for clear agriculture content marketing, better search visibility, farm lead generation, and useful product information.
What does the funding gap reveal?
The program’s scale does not mean every producer will adopt connected technology. Grain Producers Australia, for example, identifies cost, connectivity, and practical implementation as barriers affecting autonomous machinery uptake.
That distinction matters. Government funding can reduce part of the purchase cost, but the producer still has to decide whether the technology fits the business.
For an ag marketing agency, that makes education part of the customer journey. A supplier’s website may need detailed ag product pages, calculators, case studies, FAQs, technical specifications, and evidence rather than a simple product brochure.
Why Is The Round 3 Rebate Pool Set At $10 Million?
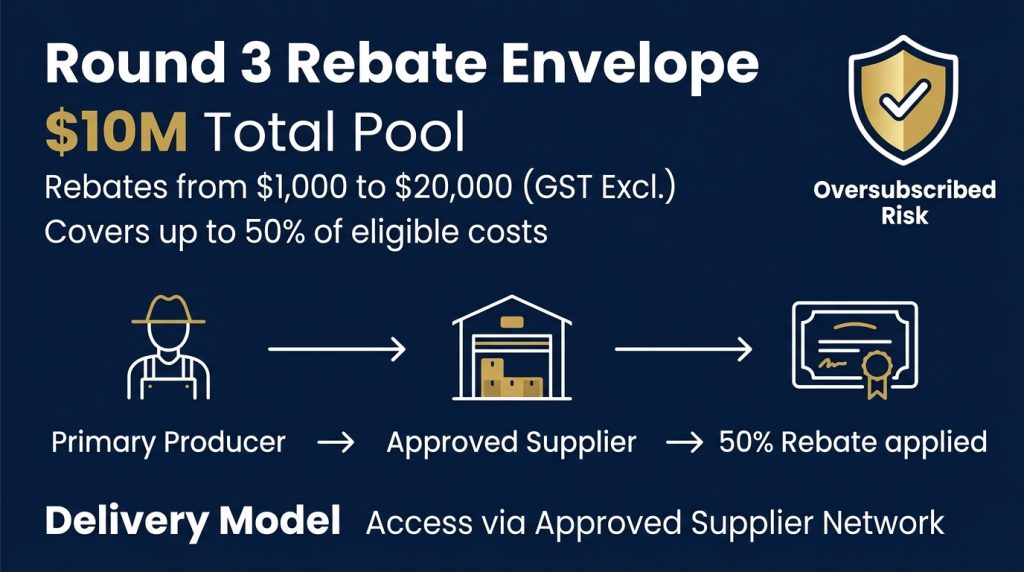
The $10 million Round 3 pool provides a defined funding envelope for eligible connected and agricultural technology purchases.
The Australian Government confirms that Round 3 is open and provides rebates between $1,000 and $20,000 GST exclusive, with rebates covering up to 50% of eligible purchase costs.
The structure matters because the program is demand-driven. The official grant page says the opportunity may be oversubscribed, and applications can stop being assessed if available funding is exhausted.
That creates a practical difference between knowing that a grant exists and understanding how to act on it. Producers need to check eligibility, identify suitable equipment, compare approved suppliers, and understand the financial contribution required.
The program’s Approved Supplier model also means primary producers access the rebate through approved suppliers rather than applying as a standalone grant recipient.
What should agribusiness marketers communicate?
A technology provider competing for producer attention should make five things easy to understand:
- Eligibility: Who can use the program?
- Rebate value: What proportion of the purchase may be covered?
- Technology: Which products are eligible?
- Business outcome: What operational problem does the technology address?
- Next step: How does the producer obtain a quote and proceed?
That structure supports agtech web design, agricultural web design, farm website design, and agricultural conversion rate optimization because it matches the questions producers already need answered.
Of course, the funding language must remain precise. A business should not promise that a producer will receive a rebate before eligibility and application requirements have been satisfied.
How Does The $20,000 Maximum Rebate Shape Producer Decisions?
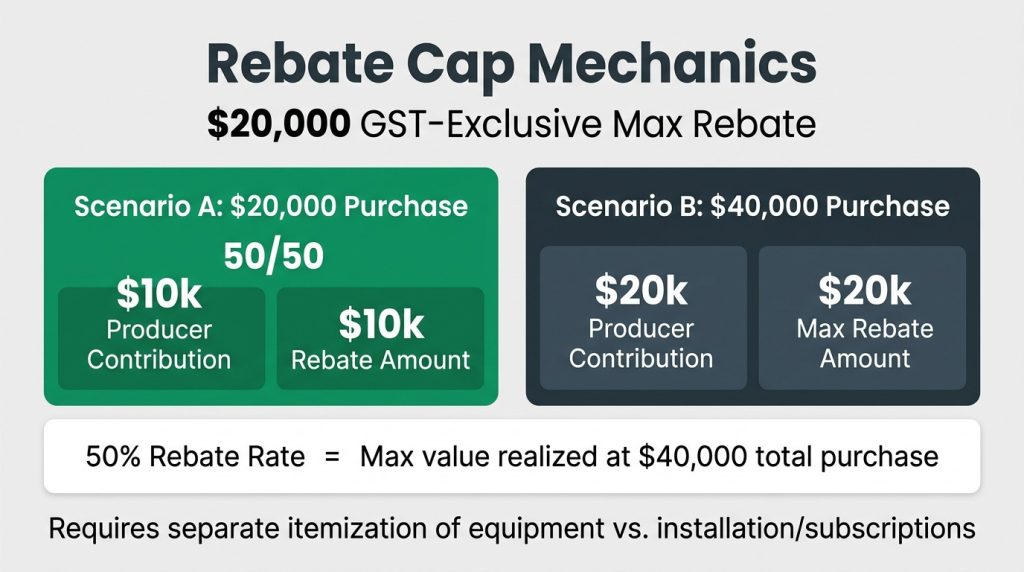
The $20,000 GST-exclusive maximum gives eligible primary producers a clear ceiling when assessing Round 3 investments.
The official Round 3 rules allow a rebate of up to 50% of eligible purchase costs, capped at $20,000 per eligible primary producer ABN. This means the maximum rebate corresponds to up to $40,000 of eligible equipment value.
The calculation makes purchase planning more concrete. A producer considering $20,000 of eligible equipment could potentially receive up to $10,000, assuming all requirements are met. A $40,000 eligible purchase could potentially reach the $20,000 cap. Purchases above that amount may still be possible, but the rebate remains capped.
This makes price transparency more useful. Technology providers should separate equipment costs from installation, delivery, training, subscriptions, and other charges where relevant because the program has specific rules for eligible expenditure.
| Information | Why it matters |
| Maximum rebate | Sets the funding ceiling |
| 50% rebate rate | Helps producers estimate potential support |
| Eligible equipment | Defines what can qualify |
| Total purchase price | Shows the producer’s likely contribution |
| ROI evidence | Helps assess whether the investment makes commercial sense |
A strong farm landing page optimisation strategy can place these details close to product information rather than forcing producers to search across multiple pages.
What information can websites make clearer?
A useful agricultural product page can connect the funding question with the purchasing question.
- Rebate amount
- Eligible technology
- Total investment
- Producer contribution
- Expected operational outcome
- Installation and support
- Application pathway
The objective is not to replace official grant guidance. Farm Table can instead help agribusinesses communicate complex information clearly while directing producers to authoritative program requirements.
What Does $30.5 Million Delivered To Almost 3,000 Producers Tell Us?
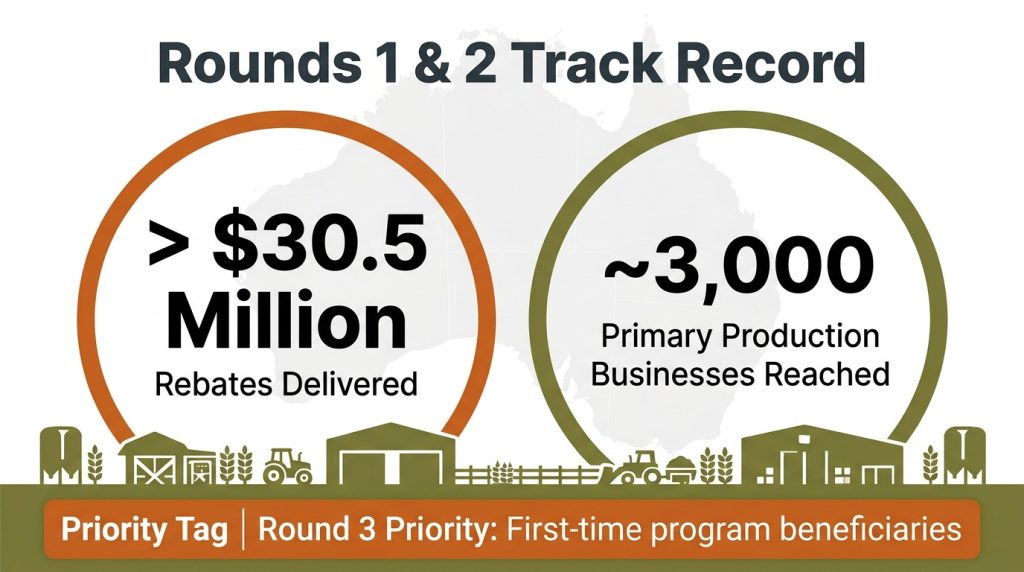
The $30.5 million already delivered through Rounds 1 and 2 shows that thousands of primary production businesses have participated in the program.
The Australian Government reports that the first two rounds delivered more than $30.5 million in rebates to almost 3,000 primary production businesses.
That history provides useful context for Round 3. The program is not starting from zero. Previous rounds created an existing supplier network, producer experience, and a base of connected equipment adoption.
Round 3 also changes the priority structure. The Department of Infrastructure says eligible primary producers that have not previously received a benefit will receive priority, helping extend access to more businesses.
- Previous funding exceeded $30.5 million.
- Almost 3,000 producers benefited.
- Round 3 provides another $10 million.
- First-time program beneficiaries receive priority.
Why does previous delivery matter?
Previous participation shows that producers will engage with a rebate when the technology and commercial case make sense.
It also creates a communication opportunity for suppliers. Real farm applications can explain how connected equipment works in practice, while agriculture case studies, testimonial videos, and farm success stories can provide context that technical specifications cannot.
That said, previous participation should not be treated as proof that every technology investment produces the same result. Farm size, connectivity conditions, enterprise type, labour requirements, and existing systems can all affect outcomes.
Who Qualifies With A $40,000-$4 Million Average Annual Gross Income Range?
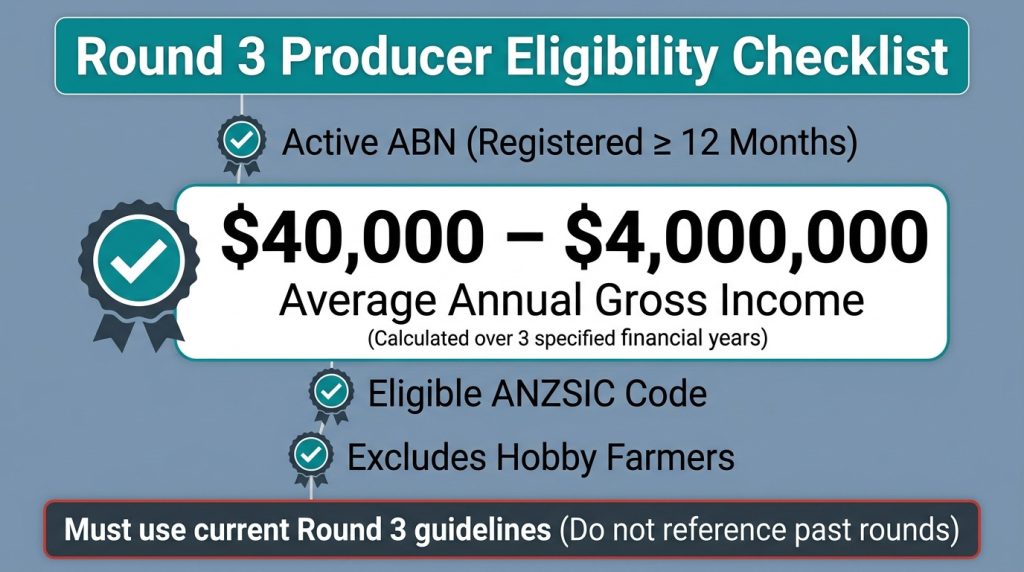
Round 3 defines eligible primary producers partly through an average annual gross income range of $40,000 to $4 million over three specified full financial years.
The current business.gov.au guidance states that eligible primary producers must have an ABN registered for at least 12 months, operate under an eligible ANZSIC code, have average annual gross income between $40,000 and $4 million, and not be a hobby farmer.
The income requirement is therefore only one part of eligibility. Producers should use the current Round 3 guidelines rather than relying on descriptions from earlier program rounds.
This distinction matters because program settings have changed between rounds. The Department specifically warns that previous-round guidelines and equipment lists should not be used as references for Round 3.
How should eligibility information be presented?
Agribusiness websites can make eligibility easier to understand without attempting to interpret government rules independently.
- State the relevant requirement.
- Link producers to the current official guidance.
- Separate program rules from commercial claims.
- Explain which products appear relevant.
- Provide a clear supplier contact pathway.
For agri-business website development, this is a practical example of user-focused information architecture. A producer should be able to identify whether a product is worth investigating before making a sales call.
Why Are 45% Of Grain Producers Using Semi-Autonomous Machinery?
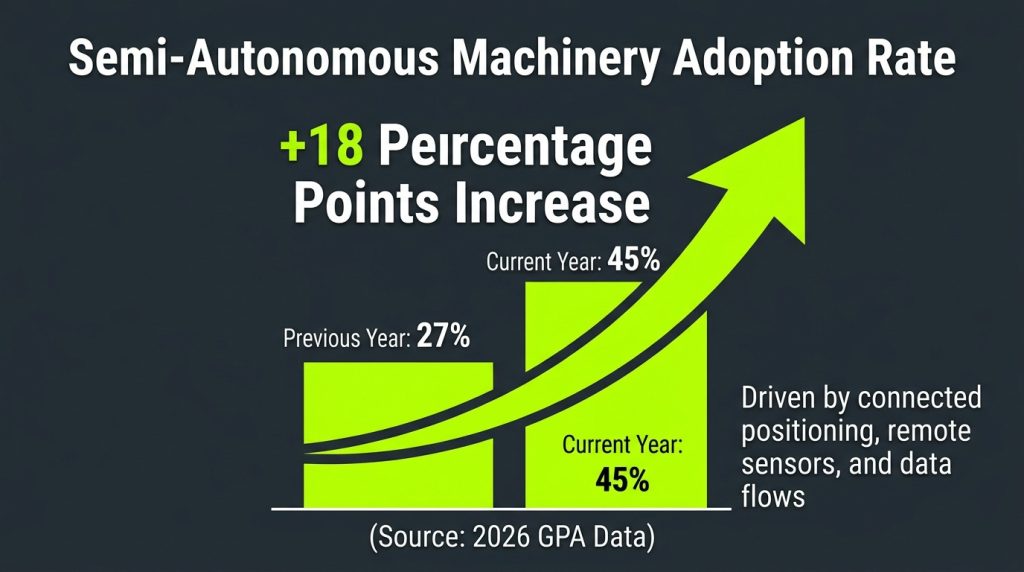
The supplied 2026 Grain Producers Australia data shows 45% of surveyed grain producers using semi-autonomous machinery, up from 27% the previous year.
The increase points to a faster move from awareness toward practical use of automation. Grain Producers Australia, working with the Tractor and Machinery Association of Australia and the Society of Precision Agriculture Australia, reports that adoption is being shaped by cost, connectivity, and return-on-investment questions.
The change is commercially relevant because semi-autonomous systems can depend on connectivity, positioning, sensors, software, and reliable data flows. As more producers use these systems, the underlying connectivity environment becomes part of the technology decision.
| Survey measure | Result |
| Previous-year semi-autonomous adoption | 27% |
| Current reported adoption | 45% |
| Change | 18 percentage points |
For technology suppliers, the lesson is not simply to advertise automation more aggressively. Producers need to understand how a system fits into existing machinery, farm workflows, support arrangements, and connectivity conditions.
What does the adoption change show?
The reported 18-percentage-point increase suggests a substantial shift among the surveyed grain producers.
- Automation is moving beyond early experimentation.
- Connectivity is becoming more relevant to machinery decisions.
- Producer education remains necessary.
- Support and installation can influence adoption.
- ROI evidence can help move technology from interest to purchase.
That creates room for farm technology adoption campaigns, agricultural video marketing, agtech web design, and targeted content that explains technology in operational terms.
Why Do 68% Of Farmers Cite Cost As A Barrier To Autonomous Machinery?
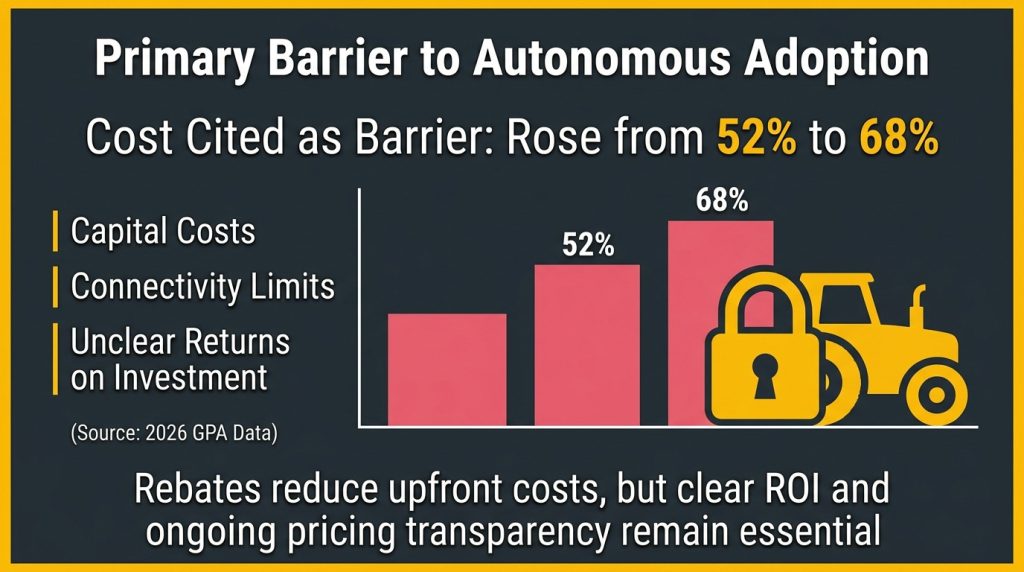
The supplied 2026 GPA data reports that 68% cite cost as a barrier to autonomous machinery adoption, up from 52%, showing that affordability remains a central issue even as adoption grows.
Grain Producers Australia says its 2026 research found cost and connectivity issues continue to limit autonomous machinery uptake, alongside questions about practical implementation and return on investment.
The increase from 52% to 68% is notable because it suggests the affordability question has not disappeared as technology becomes more familiar. A producer may understand the technology and still decide that the capital requirement does not fit the business.
Round 3 can reduce part of that initial financial barrier for eligible purchases, but the rebate does not eliminate the remaining producer contribution.
What can agribusiness websites explain?
A supplier’s digital presence can answer the financial questions before a sales conversation:
- Upfront equipment cost
- Potential rebate
- Producer contribution
- Installation requirements
- Ongoing subscription costs
- Expected operational benefits
- Evidence supporting ROI claims
This is where agriculture SEO services, agricultural keyword research, ag product pages, and farm lead generation intersect. Producers searching for a technology solution often need commercial information as much as technical information.
A clear page can reduce uncertainty, but it cannot manufacture a positive ROI. The strongest agricultural digital strategy therefore connects product claims to credible evidence, farm context, and transparent costs.
Why Are 40-50% Of Australian Farmers Adopting Innovative Practices?
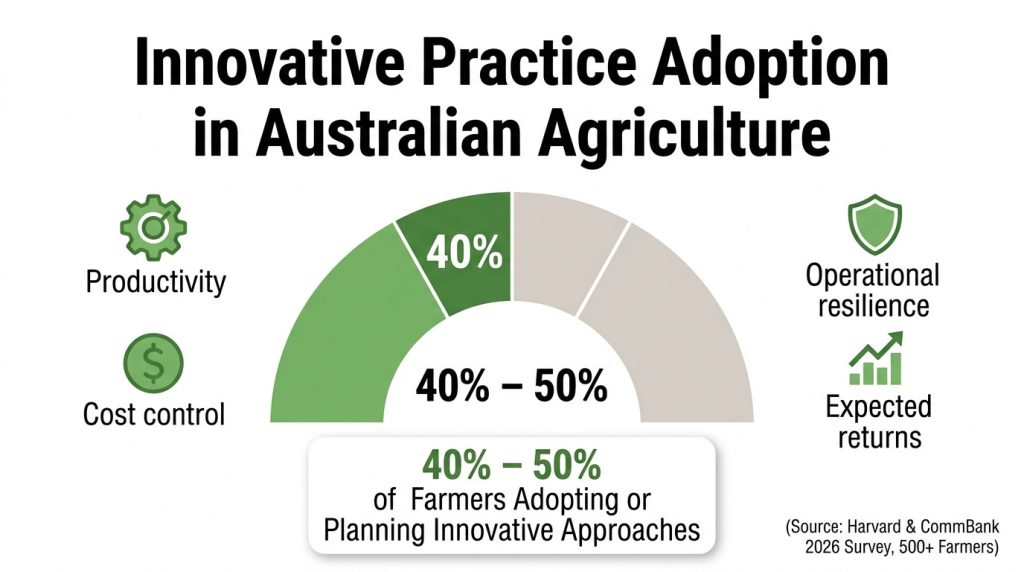
Between 40% and 50% of Australian farmers surveyed are adopting new technology or planning to do so. This shows that new tools and farm practices are no longer limited to a small group of early adopters.
The Harvard University and Commonwealth Bank Farms in Focus 2026 research surveyed more than 500 farmers, with 348 complete responses used in the analysis. It found adoption or plans to adopt new approaches at 40% to 50%.
Farmers aren’t adopting technology just because it’s available. Productivity, cost control, farm resilience, and expected returns are key reasons for change.
This matters for the $10 Million On Farm Connectivity Program Round 3 because connectivity supports sensors, machinery systems, remote monitoring, data tools, and automation.
The opportunity goes beyond selling hardware. Agribusinesses need to show how a connected solution fits into farm operations and what problem it can solve.
- 40-50%: Current or planned adoption
- Key drivers: Productivity and cost control
- Barriers: Implementation and costs
- Other factors: Finance and expertise
- Focus: Moving from interest to use
Adoption still varies by technology and farm type. A producer may adopt variable-rate spraying but delay autonomous machinery because the cost, infrastructure, and workflow needs differ.
What does adoption tell marketers?
The research suggests that agricultural marketing needs to move from novelty toward practical business value.
For an ag marketing agency, that means creating content around real farm problems rather than simply promoting technical features.
- Explain the operational problem.
- Show how the technology addresses it.
- Provide evidence from relevant farm contexts.
- Explain implementation requirements.
- Make the commercial case easy to evaluate.
This approach supports agriculture content marketing, agricultural case studies, farm storytelling content, and farm technology adoption campaigns without assuming every producer has identical needs.
Why Do 50% Of Farmers Want Clearer ROI Information?
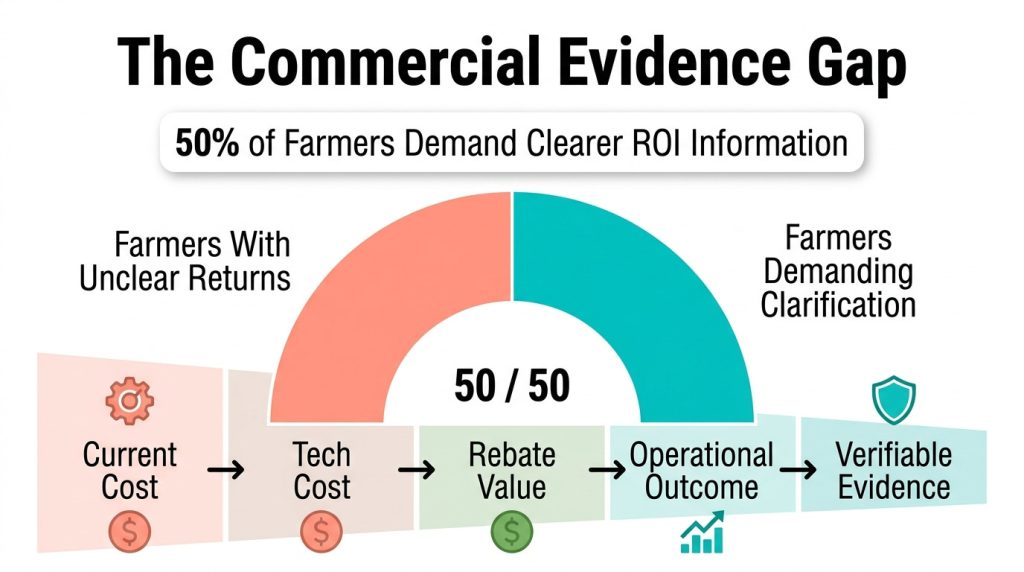
The supplied Farms in Focus data found that 50% of farmers want clearer information about technology returns. That points to a need for stronger commercial evidence during technology research.
The wider Harvard and CommBank research found that farmers make careful business decisions about new technology. Complexity, finance, and unclear returns can slow adoption.
ROI matters because connected technology can cost more than the equipment itself. Producers may also need to pay for installation, software, maintenance, training, data, integration, and staff time.
A product page that only lists features leaves key questions unanswered. Producers need to know what could change after implementation and whether the expected results support the cost.
The $20,000 Round 3 rebate ceiling makes this more relevant. Even when a purchase qualifies, the producer may still need to fund part of the cost.
A useful ROI framework can cover:
- Current Problem: What is costing the farm?
- Technology: What does the product change?
- Investment: What does it cost?
- Funding: What rebate may apply?
- Outcome: What improvement could occur?
- Evidence: What supports the estimate?
A strong ag product page can answer these questions without promising results that can’t be supported.
Why does ROI communication matter?
The gap is partly a marketing problem and partly an information problem.
Agribusinesses selling complex technology need agriculture SEO services, agricultural keyword research, conversion-focused landing pages, and evidence-led content that helps producers compare solutions.
That content might include:
- Farm case studies
- Cost calculators
- Product comparison pages
- Implementation guides
- Frequently asked questions
- Technology compatibility information
- Rebate explanations
Of course, ROI will differ between farms. Weather, commodity prices, labour availability, farm scale, existing equipment, and management practices can all affect the result.
Why Do Next-Generation Farmers Manage 2.6 Farm Categories Versus 1.7 For Older Farmers?
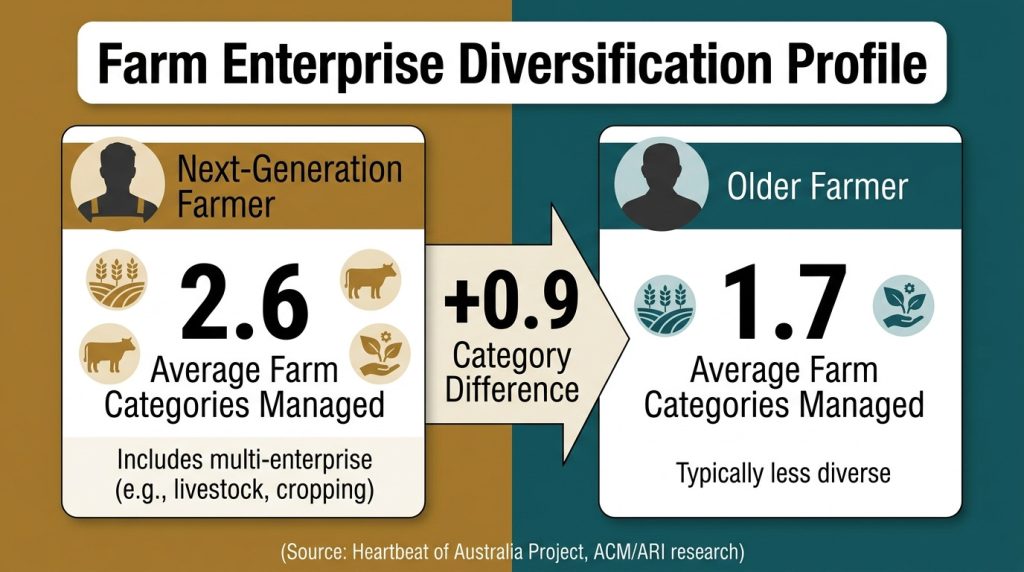
Next-generation farmers in the supplied Heartbeat of Australia research manage an average of 2.6 farm categories, compared with 1.7 among older farmers, indicating a more diversified operating profile.
The research, associated with University of Canberra and the ACM/ARI Heartbeat of Australia project, points to differences in how younger farming generations operate, communicate, consume information, and approach business decisions.
The difference is commercially relevant because diversification can create a more complicated technology journey. A business operating livestock, cropping, horticulture, or complementary enterprises may need several technology systems rather than one solution.
| Farmer group | Average farm categories |
| Next-generation farmers | 2.6 |
| Older farmers | 1.7 |
| Difference | 0.9 category |
A broader operation can also produce more customer touchpoints for agribusiness suppliers. One producer may research machinery, farm management software, connectivity, financial services, livestock technology, and marketing tools during the same year.
This changes how an agricultural website should be structured.
- Content needs to accommodate different enterprises.
- Product information should explain multiple applications.
- Navigation should support different user journeys.
- Case studies should reflect varied farm businesses.
- Search strategy should target both technology and application terms.
What does diversification mean for marketing?
For Farm Table, the finding supports a more segmented approach to agricultural digital strategy.
A generic website may describe what a product does. A stronger agtech web design strategy can show how that product applies to different farm categories.
That can involve:
- Farm persona development
- Ag competitor analysis
- Agricultural keyword research
- Ag customer acquisition
- Agriculture B2B lead generation
- Agricultural search visibility
The point is not to assume that younger farmers want only digital communication. The supplied research instead points toward a blended information environment, where digital tools coexist with established agricultural media and trusted industry sources.
Why Are 44% Of Next-Generation Farmers Planning Technology Purchases?
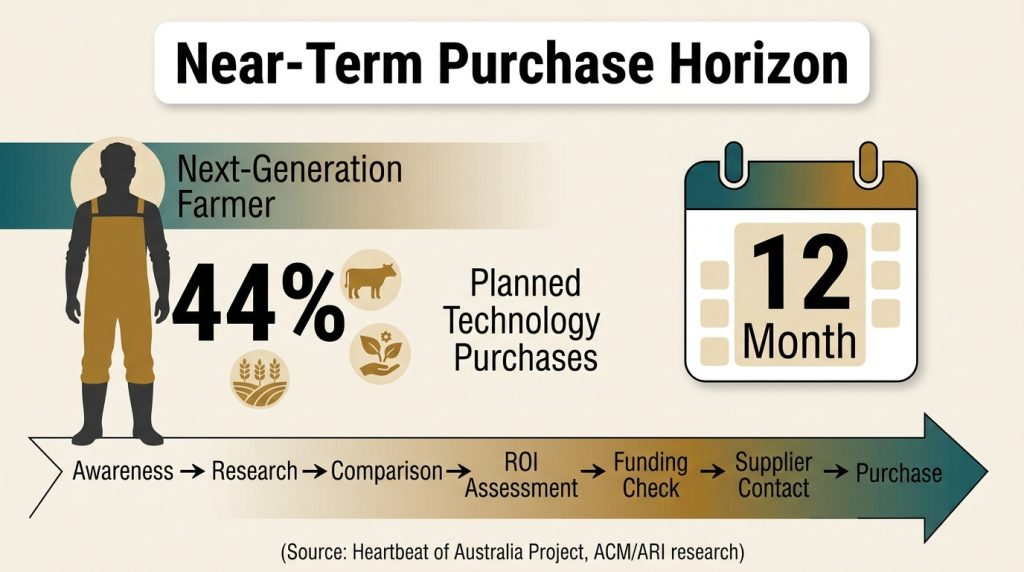
The supplied Heartbeat of Australia research reports that 44% of next-generation farmers planned technology purchases within the following 12 months, creating a substantial near-term audience for agricultural technology suppliers.
The finding becomes more useful when combined with the 2.6 farm-category figure. These producers are not simply operating diversified businesses. A sizable share is also considering new technology purchases.
That creates a defined customer journey:
Awareness – research – comparison – ROI assessment – funding check – supplier contact – purchase
Digital marketing can influence several stages without replacing trusted farm advisers, dealers, agronomists, local media, or peer recommendations.
A technology provider should therefore make its online presence useful before the sales conversation begins.
How can agribusinesses reach this audience?
The strongest approach combines search visibility with practical agricultural information.
- Build pages around real producer questions.
- Explain product applications by farm type.
- Publish evidence-based case studies.
- Provide transparent pricing information where possible.
- Explain relevant funding opportunities.
- Use agricultural video marketing for complex products.
- Build email sequences for producers who need longer consideration periods.
For an ag marketing agency, this is where farm lead generation, ag email marketing, agriculture PPC advertising, and agricultural social media marketing can work together rather than operating as separate campaigns.
A younger farming audience does not automatically mean a social-only strategy. The supplied research indicates that agricultural businesses need a blended approach that respects both digital behaviour and established sources of trust.
Why Do 65% Of First Nations Households Lack Fixed Home Internet In Regional And Remote Towns?
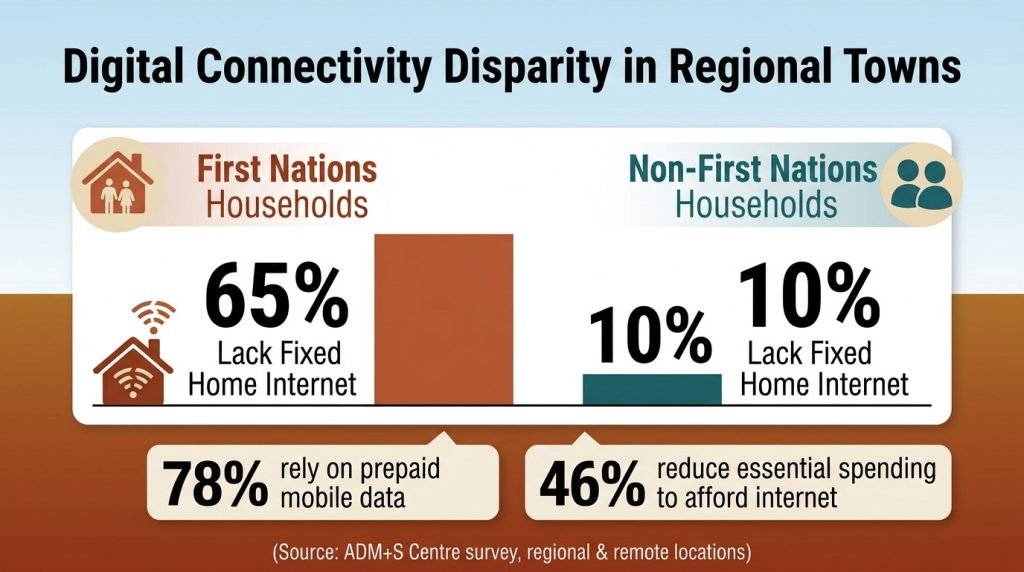
The 65% figure shows that digital connectivity remains uneven across regional and remote Australia, with surveyed First Nations households reporting substantially lower fixed-home-internet access than surveyed non-First Nations households.
The ADM+S Centre’s Counting on Connectivity research surveyed 729 First Nations people across ten regional and remote towns. It found that 65% did not have a fixed home internet connection, compared with 10% of non-First Nations respondents.
The same research found that 78% relied on prepaid mobile data and 46% had cut back on essential expenses to afford internet access.
These figures matter because digital inclusion is broader than infrastructure alone. Affordability, household circumstances, mobility, device access, and digital capability can all influence whether people can use online services consistently.
| Measure | First Nations respondents | Non-First Nations respondents |
| No fixed home internet | 65% | 10% |
| Gap | 55 percentage points | — |
| Reliance on prepaid mobile data | 78% | — |
| Cut essential spending to afford internet | 46% | — |
The research also stresses that local context matters. Different towns can have different infrastructure, population, housing, economic, and social conditions.
What does this mean for digital agribusiness?
The data provides a reason to avoid designing digital services around an assumption of unlimited connectivity.
For agricultural businesses operating across regional Australia, ag website UX design should consider:
- Mobile-first access
- Fast-loading pages
- Simple navigation
- Clear text-based information
- Limited unnecessary media
- Accessible contact options
This is especially relevant for businesses serving remote producers, contractors, suppliers, and community organisations.
The broader point is not that every farm or regional household faces the same connectivity problem. It is that Australian agriculture operates across very different digital environments.
Why Does $101 Billion In Agricultural Gross Production Value Matter?
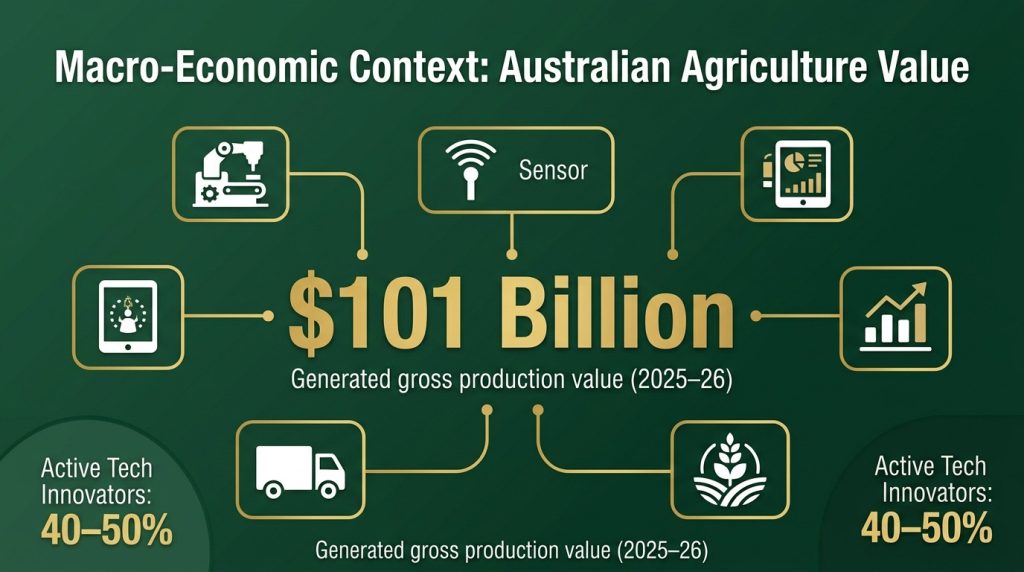
The $101 billion agricultural gross production value places farm technology, connectivity, and digital investment within one of Australia’s largest economic sectors.
CommBank’s 2026 Farms in Focus research reports that Australian agriculture generated $101 billion in gross production value in 2025–26, while its research also found that 40–50% of farmers were adopting innovative approaches.
The scale matters for technology suppliers because even small improvements in productivity, labour efficiency, resource management, and decision-making can have commercial relevance across a large production base.
It also explains why connectivity has become a business issue rather than simply an infrastructure issue. Modern agriculture increasingly uses digital systems to collect information, automate processes, monitor assets, manage inputs, and communicate with suppliers and customers.
The economic opportunity spans multiple parts of the agricultural supply chain.
- Farm equipment
- Agricultural inputs
- Farm management software
- Connectivity providers
- Financial services
- Logistics
- Advisory services
- Agtech platforms
For these businesses, agribusiness digital marketing needs to reflect the sophistication of the audience. Producers are not simply consumers of technology. They are business owners assessing capital allocation, productivity, risk, labour, and long-term returns.
What is the broader opportunity?
The $101 billion figure provides context for the wider digital market.
Agricultural branding, farm business growth online, ag product marketing, agricultural supplier branding, and ag distributor outreach all become more relevant as technology becomes embedded in farm operations.
That does not mean every agribusiness needs an elaborate digital ecosystem. The appropriate strategy depends on the customer, product complexity, sales cycle, geographic footprint, and existing distribution model.
FAQ
How can agricultural web design help my farm or agribusiness attract more customers?
Agricultural web design can strengthen your agricultural online presence by making your products, services, and contact details easy to find.
A clear farm website design can support farm lead generation, agricultural search visibility, and farm business growth online. Strong ag website UX design also helps visitors understand your offer quickly and take a clear next step toward contacting your business.
What should I include in a farm website to generate more leads?
A farm website should clearly explain your products, services, pricing information, service areas, and customer benefits. Use focused ag product pages, farm landing page optimization, and simple contact forms to support farm lead generation.
Agricultural keyword research can help target relevant searches, while agriculture content marketing can answer common customer questions. Testimonials and case studies can also support ag customer acquisition.
How can agriculture SEO services improve my online visibility?
Agriculture SEO services can improve agricultural search visibility by targeting the search terms your customers use when looking for products or services.
Start with agricultural keyword research and ag competitor analysis, then improve page content, internal links, and technical website elements.
Farm local SEO can help location-based businesses appear in local searches, while agriculture backlink building can strengthen relevant pages.
Which digital marketing strategies work well for agricultural businesses?
An effective farm digital strategy can combine agriculture content marketing, agricultural social media marketing, ag email marketing, and agriculture PPC advertising. The right combination depends on whether you need grower targeted marketing, agriculture B2B lead gen, or ag direct-to-farm sales.
Agriculture marketing automation can organize lead follow-ups, while website analytics can track traffic, enquiries, conversions, and customer acquisition.
How can I turn an agricultural website into a stronger sales tool?
Start by matching your website content to the questions customers ask before making a purchase or contacting your business. Use ag product pages, farm landing page optimization, and agricultural conversion rate optimization to make important actions easier.
Ag user journey mapping can identify where visitors leave, while ag A/B testing and agriculture heatmap analysis can show which page elements need improvement.
What Does Round 3 Mean For Australian Agribusiness?
The $10 million Round 3 funding gives eligible producers another reason to consider connected technology, but funding alone won’t make adoption easier. Agribusinesses still need to explain costs, practical benefits, setup requirements, and expected returns in terms producers can understand.
For Farm Table, this creates an opportunity to help agribusinesses communicate clearly across funding, technology, and broader digital needs. Explore Farm Table’s Agricultural Digital Services here. The funding window is limited, but the need for useful agricultural information will continue well beyond this round.
Share